
One of my favorite things to do with data is make it look like other things: chocolate, blood droplets, cigarette smoke, did I mention chocolate? So when I saw a Makeover Monday data set focusing on Asian cuisine in the U.S., my first thought was, “How can I turn this data into noodles?”
Like most of my forays into custom charts, this one started with a search to see if someone had already cracked the code (there’s no need to build from scratch if I don’t have to!). Luckily, Toan Hoang had just what I needed: a fantastic path chart tutorial that did all the heavy lifting. He figured out the logic, the math, built the foundation, and made it easy for me to noodle with the details. So let’s dig in and fry up some data noodles in Tableau!

Instant Noodles (The Template)
I’ll walk you through how to create noodle bars, but if you want to skip the setup and jump right into noodling, I’ve created a template to get you started. Just download this spreadsheet, update it with your data, swap it out in the Tableau workbook, and you’re good to go!
What’s in the Wok? (The Dataset)
To create the noodle shapes, start with a helper dataset consisting of a single column of 400 points, numbered from 0 to 399 (make sure your points start at 0). I tested a few different ranges, but 400 hit the sweet spot for giving me the right bar length and smoothness I wanted in the curves.
Next, bring in the data you want to visualize. The template data looks like this:
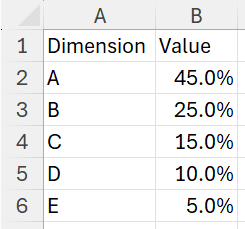
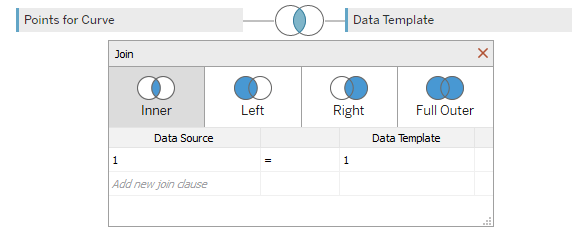
Join the helper data (Points for Curve) and the Data Template using a Cartesian join. I created a custom join field of ‘1’ in both datasets and joined the two on that field. This effectively duplicates each row in your main dataset 400 times, allowing you to plot the curved paths for each noodle bar.
Use Your Noodle (Logic Behind the Lines)
As I mentioned, Toan Hoang deserves all credit for figuring out the logic and math here. I’ll be recapping what he covers in his tutorial and discussing how I modified it to make bar charts.
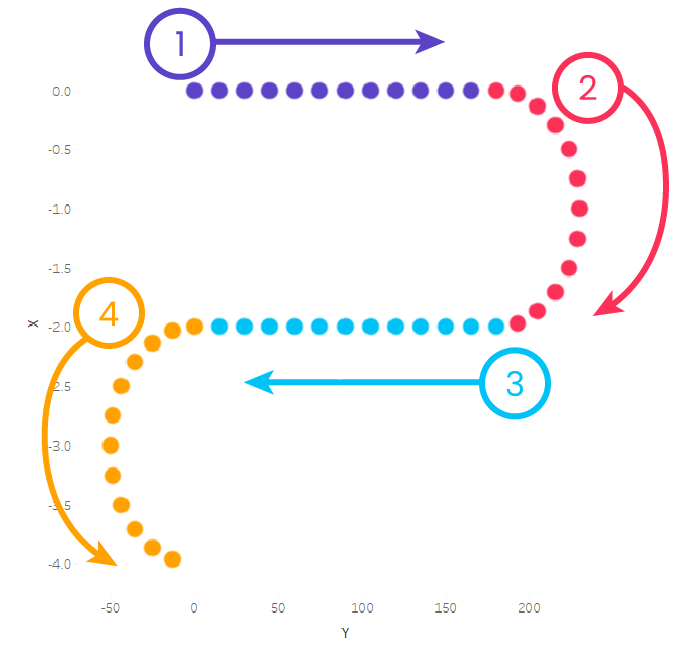
I’m calling these “Noodle Bars”, but in reality, they’re not bar charts at all; they’re points connected by a line. In order to get that line to go back and forth across the view, we need to think about the line in four segments:
- Straight line (left to right)
- Curve (right side)
- Straight line (right to left)
- Curve (left side)
To control the direction and curve of each part of the line, we’ll assign each point to one of the four segments, then tell Tableau what to do with each segment.
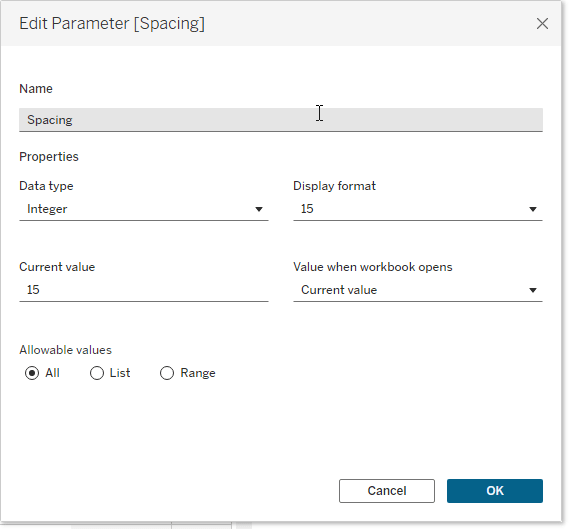
- Create a Spacing parameter with the data type set to Integer. This will determine the distance between the points on your line.
- Create a calculated field that assigns a position to each point along the line using the Point value and your Spacing parameter.
Index
([Point])*[Spacing]
- Next, we need to figure out which segment each point belongs to. To do that, create a calculated field that divides the Index by 180. Why 180? Because 180 degrees is half a circle and will allow us to generate smooth curves on the path.
Segment Number
INT([Index]/180)
Once each point is assigned a Segment Number, the next step is to tell Tableau how to plot the points of each segment using X and Y coordinates.
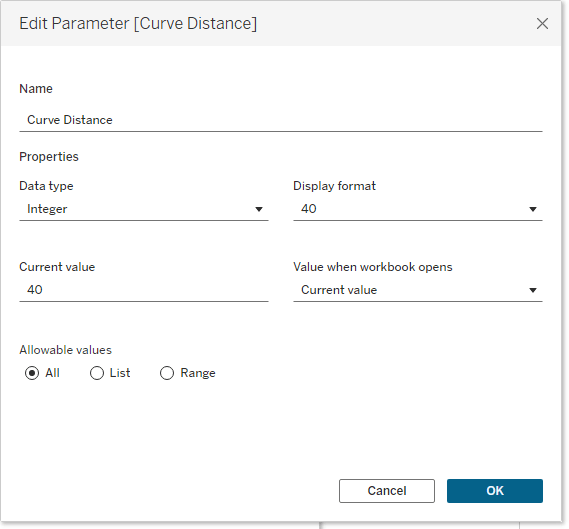
- To control the curve’s shape, create a Curve Distance parameter and set the data type to Integer. This parameter will adjust the amplitude of the curve to control how tall or deep the waves in the noodle will be.
- Now, let’s create the X coordinate by defining different behaviors based on the Segment Number. Each segment corresponds to a different part of the noodle’s path:
- When Segment Number % 4 = 0, the line moves straight from left to right.
- When Segment Number % 4 = 1 the line curves to the right using a sine function.
- When Segment Number % 4 = 2, the line moves straight from right to left.
- When Segment Number % 4 = 3, the line curves to the left using a sine function.
Note: The modulo operator (written as %) gives you the remainder when one number is divided by another.
X
//Straight left to right
IF [Segment Number]%4 = 0
THEN [Index]-(180*[Segment Number])
//Right curve
ELSEIF [Segment Number]%4 = 1
THEN 180+SIN(RADIANS([Index]-180))*[Curve Distance]
//Straight right to left
ELSEIF [Segment Number]%4 = 2
THEN (([Segment Number]+1)*180)-[Index]
//Left curve
ELSEIF [Segment Number]%4 = 3
THEN SIN(RADIANS([Index]-180))*-[Curve Distance]
END
- Next, let’s create the Y coordinate. The logic here changes depending on whether the point belongs to a straight or curved segment:
- For straight segments moving left to right and right to left (Segment Number % 2 = 0), the Y position stays constant, simply stepping down with each segment.
- For curved segments on the right and left (Segment Number % 2 <> 0), we add a cosine function to create the vertical curve effect.
Y
//Straight line segments
IF [Segment Number]%2 = 0 THEN -[Segment Number]
//Curved line segments
ELSE (-[Segment Number]+COS(RADIANS([Index]-180)))
END
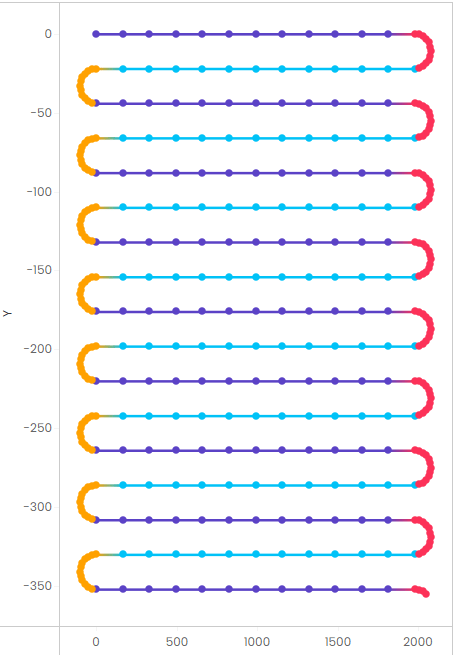
Here’s a color-coded version to better visualize the behavior of each segment:
Let’s Wok and Roll! (Building the Chart)
Time to put it all together and build our noodle bars!
- Set the Mark Type = Line
- Drag Point to Path
- Make sure it’s a dimension
- Place X on Columns
- Place Y on Rows
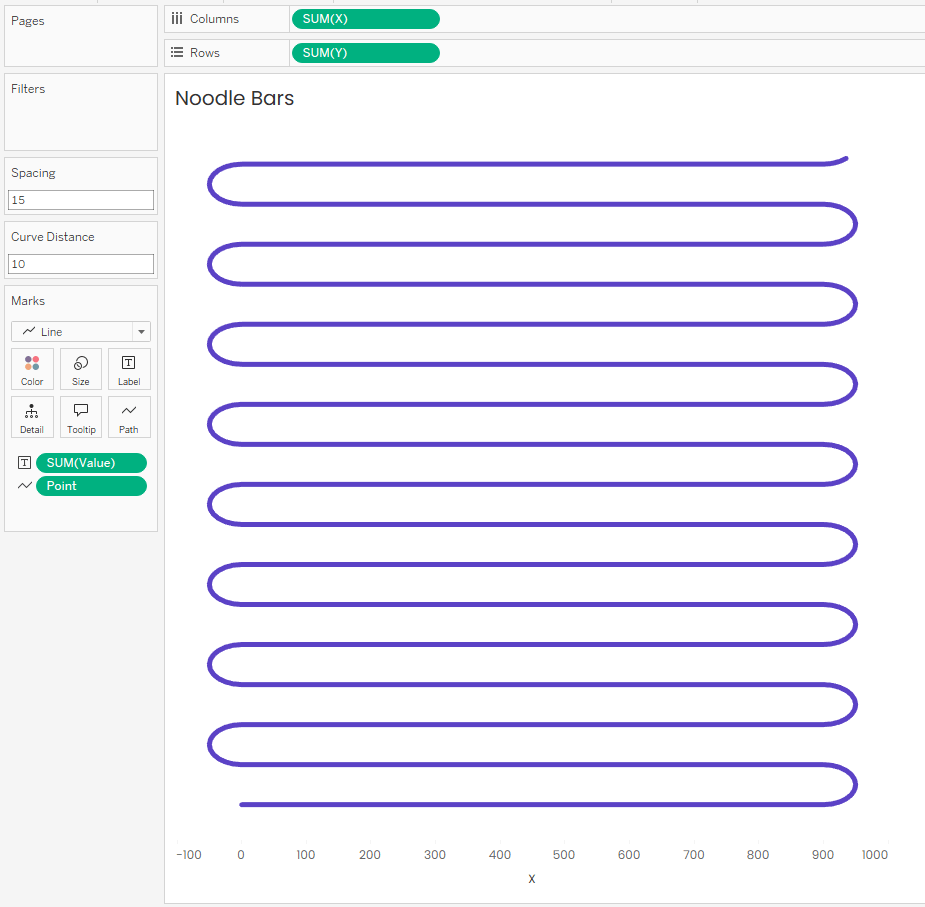
- Set Spacing to 15
- Set Curve Distance to 10
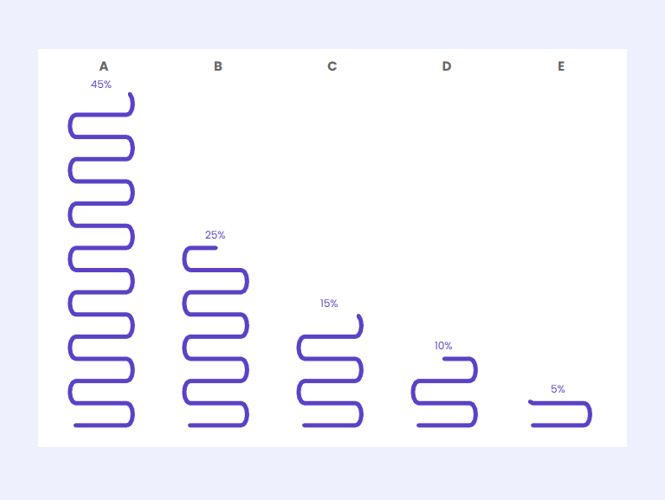
If you’ve done everything correctly, you should see a wavy noodle shape take form!
Add your Dimension to Columns to get a noodle for each category.
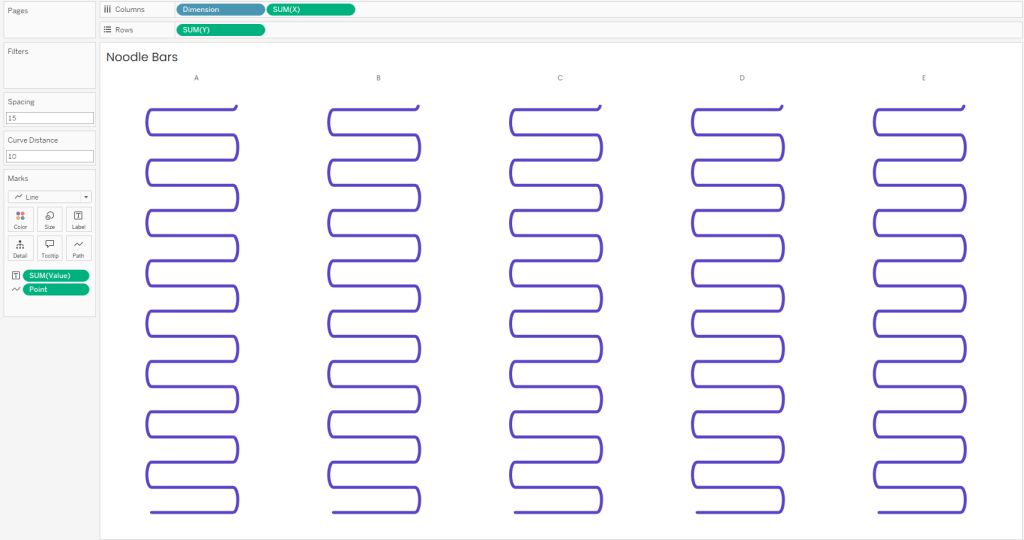
Now let’s make the noodles represent the values in the data.
Create a calculated field called Keep Point. Just like the name suggests, this field will keep the points that should be shown and hide the rest. It checks whether the current Point is less than Value * 400. (Note: if you used a different number of points in your helper dataset, replace 400 in the calculation below with the number of points you used.)
Keep Point
SUM([Point]) < SUM([Value])*400
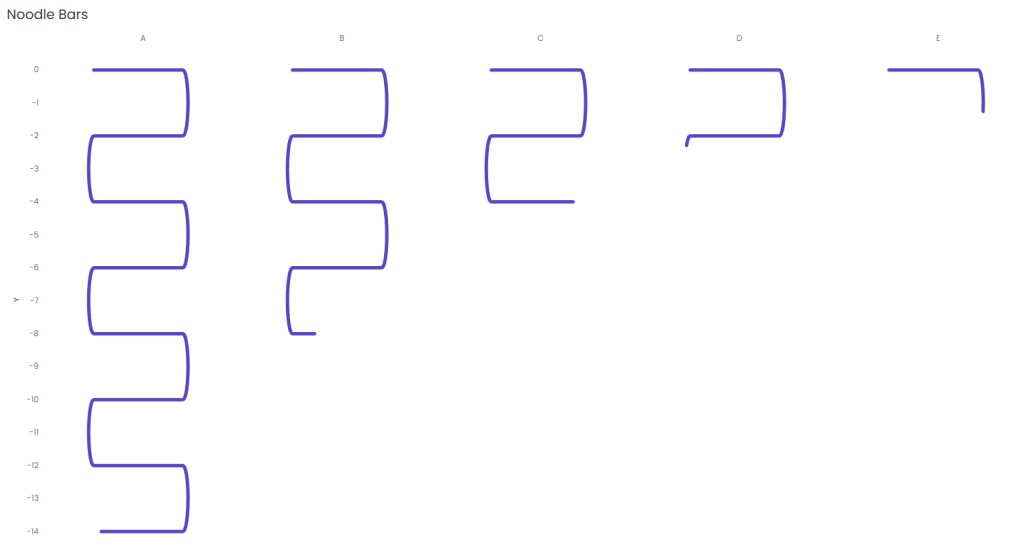
Use Keep Point as a filter and retain TRUE values. This will trim each noodle to accurately reflect its value.
Heads up, at this stage your noodles will be upside down:
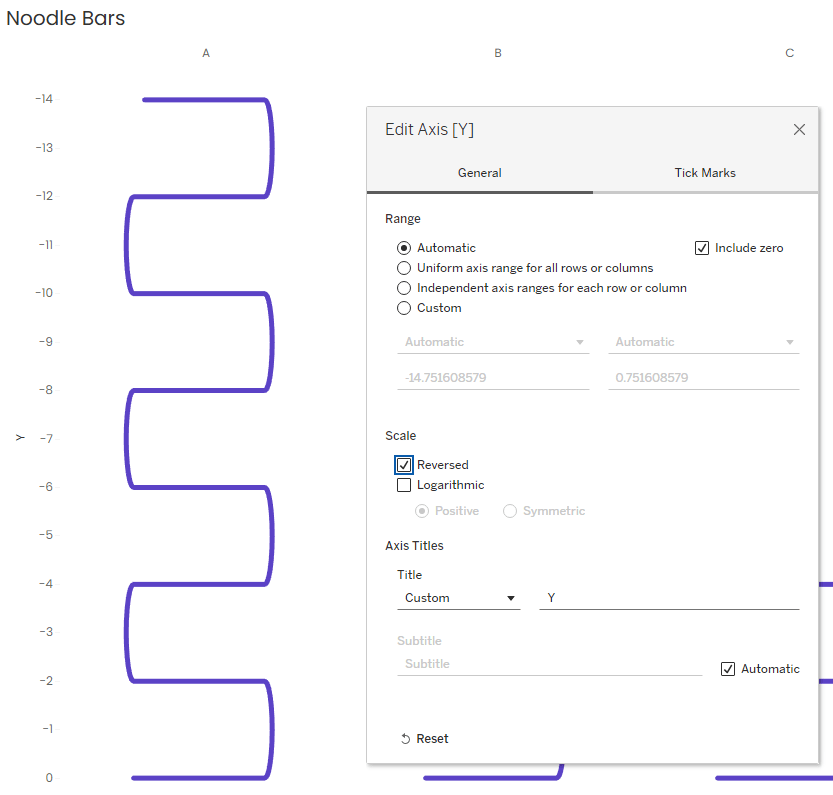
Just reverse the axis and they’ll flip right side up.
Now it’s time to adjust your Spacing and Curve Distance parameters until you get the look and feel you want. Tip: it’s helpful to adjust these parameters from the dashboard since your sheet will look slightly different on the dashboard compared to the sheet.
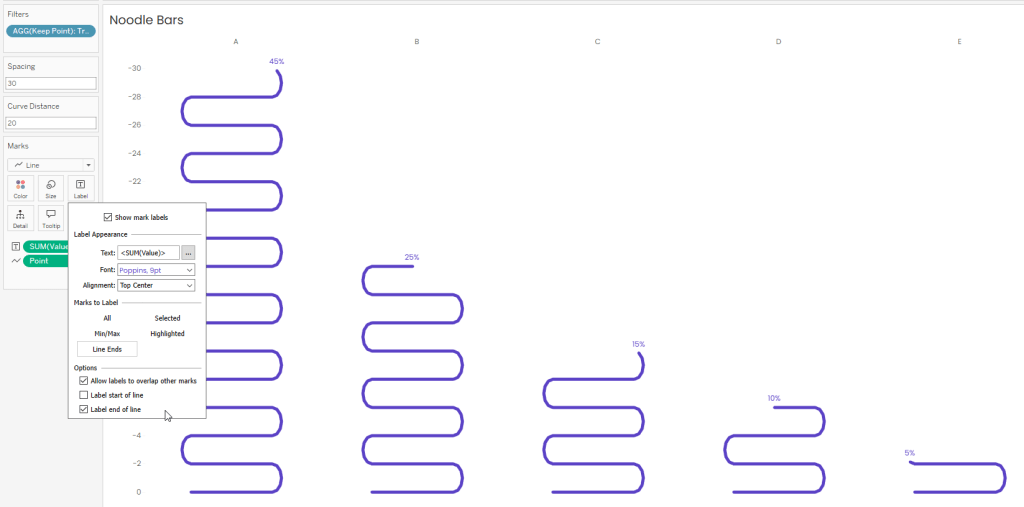
You can add data labels to the end of your line to let users know what values the noodles represent. However, when you do this, you’ll notice the labels aren’t centered on the noodle bars; they’re placed at the end of each line (and each line ends at a different X coordinate):
To make centered labels, I added MIN(90) to Columns and set its Mark Type to Line. Then I created a dual axis chart, added labels to the end of the MIN(90) line, and set its opacity to 0% to make it invisible.

This little trick let me center the labels perfectly on each noodle bar!
You may also want to modify your X axis to add some space between your noodles. I changed mine to -100 to 300 to add a bit of a buffer between each category.
No More Noodling Around (Wrap Up)
And there you have it! Data turned into noodles with a little trigonometry, a dash of creativity, and a whole lot of fun. Again, big thanks to Toan Hoang for the tutorial that made it possible for me to transform a dataset into a takeout box full of wavy, dynamic noodles!

Leave a comment