

Welcome
I love sharing my knowledge and passion for data and Tableau. Browse my blog, check out my portfolio, or search for something specific.
Latests Posts
-
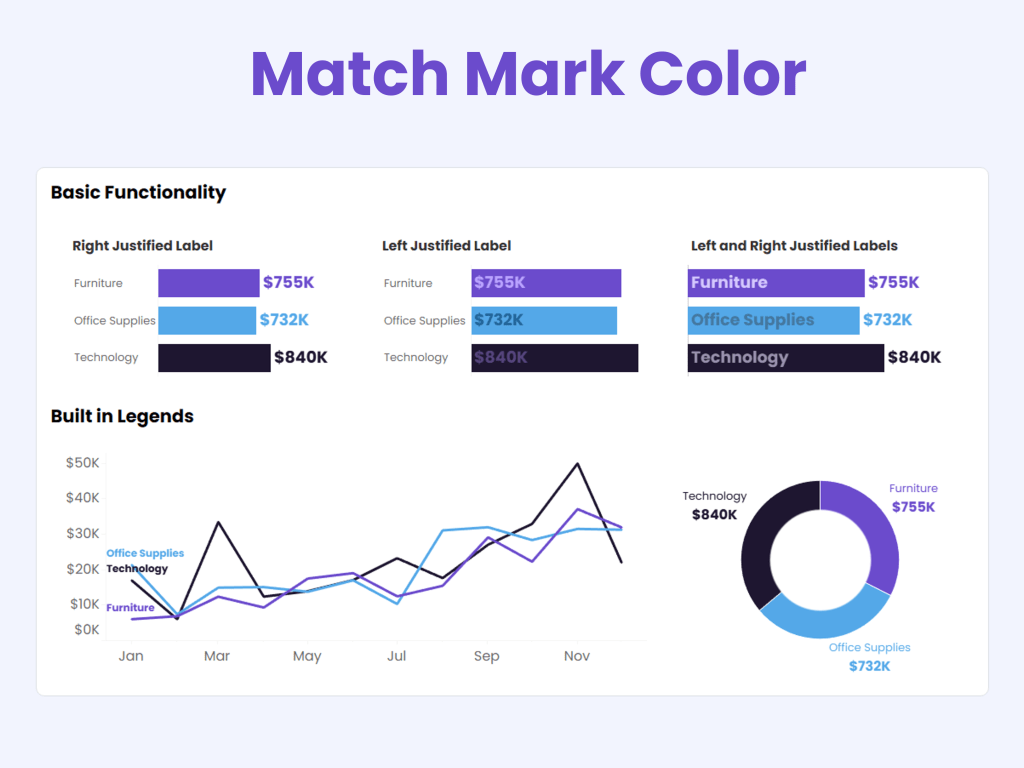
Leveraging “Match Mark Color”
The “Match Mark Color” feature in Tableau might not be the newest trick in the book, but it’s certainly one of the most underrated in my opinion. Introduced all the way back in version 9.2, this feature allows you to automatically match the color of your text labels to the color of the marks they’re…
-
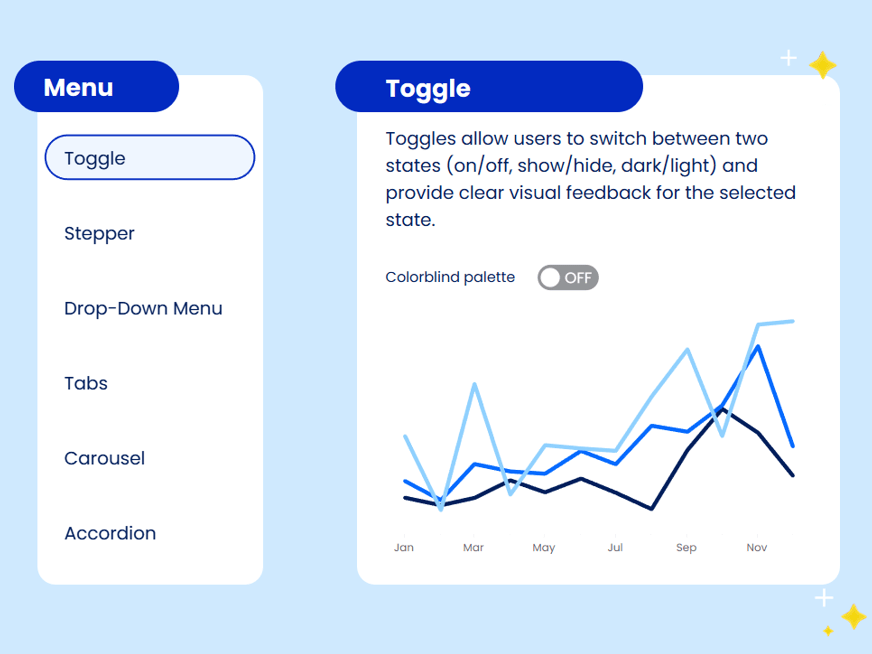
Tutorial: Navigation Menu
It should be pretty obvious at this point that I’m not a huge fan of Tableau’s default UI. There’s nothing necessarily wrong with it…it just doesn’t pack much wow factor. So I often find myself getting creative with Tableau’s mark types, parameters, and dynamic zone visibility to create more customized UI. I posted this viz…
-
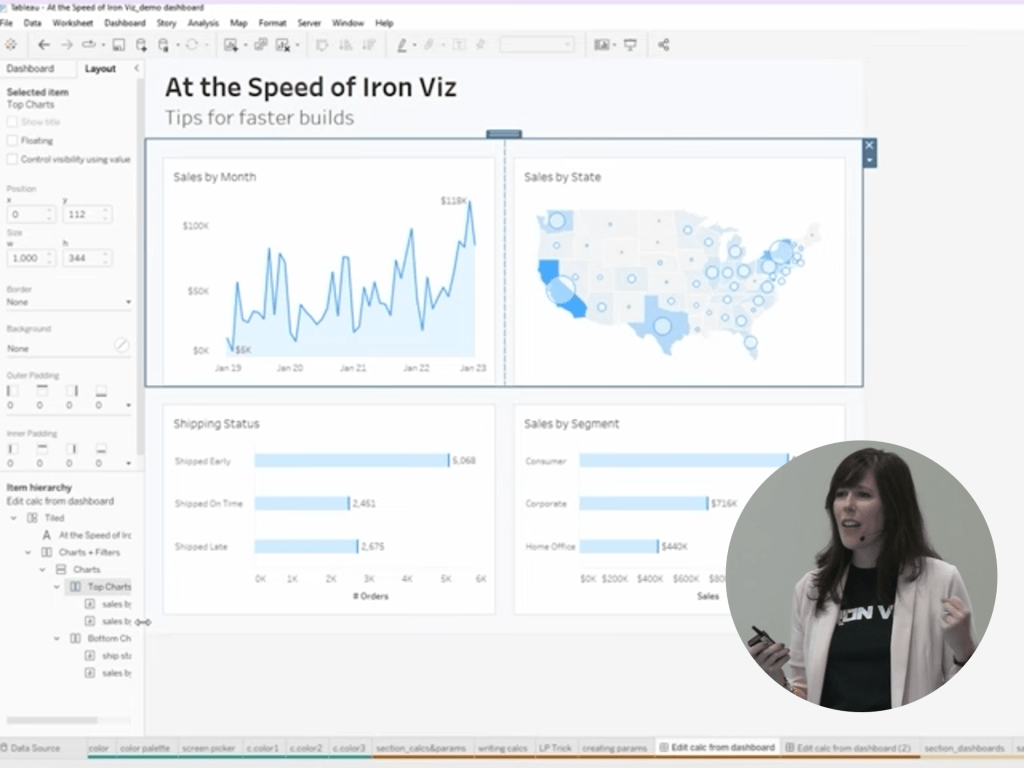
Present Tableau Like a Pro
You’ve just been invited to speak at a conference, a Tableau User Group, or another speaking engagement. Yay!! Time to celebrate and dance! Now comes the next step: creating a presentation that’s not only engaging, but includes a smooth, compelling Tableau demo (no pressure, right?!). It can feel like a lot, but it doesn’t have…
