
One of my favorite ways to get end users engaged with dashboards is by turning learning into a game. At work, I’ve built several interactive games in Tableau that boost engagement and help build dashboard and data literacy.
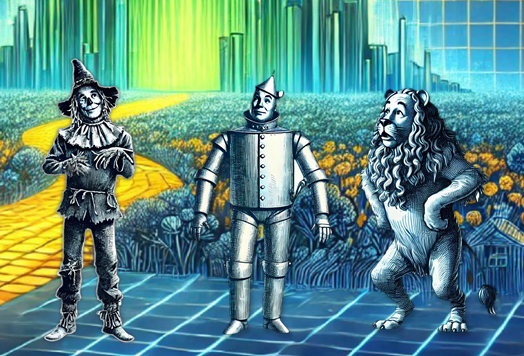
My latest creation, Emerald City Insights, invites users to follow the Yellow Brick Road, meet the Scarecrow, Tin Man, and Cowardly Lion, and help each character answer questions about key dashboards at our organization. If all goes well, their world shifts from black & white to full Technicolor, and the gates of the Emerald City swing open and welcome them to a world full of data literacy.
I’ve recreated the Emerald City Insights challenge on Tableau Public, using links to my own Public vizzes as examples. In this blog post, I’ll show you how you can download the workbook, update it with your own dashboards, and guide your organization down the Yellow Brick Road to the Emerald City. And if you’re interested, I’ll go into the mechanics of how it all works.
- Download the workbook here.
- All the data and images are located here.
- Note: all images were generated using AI.
Update the Workbook
Once you’ve downloaded the workbook, you’ll need to update each character’s challenge so it points to your organizations dashboards. Here’s what to do:
- Update the speech bubble text
- Give each character something new to say, and make the text refer to your dashboard. For context, here’s what the Scarecrow said on the version I made for work:
- Well, howdy there! Name’s Scarecrow, and I’ve been stuck here in this field, scratching my straw-filled head over a mess of data I can’t make sense of. Oh, what I would give for something that could show me how many students are enrolled and what their demographic makeup is… If I only had a Student Profile Dashboard to help answer the questions on this page!
- Note: You will need to update the text on the black & white and Technicolor versions.
- Give each character something new to say, and make the text refer to your dashboard. For context, here’s what the Scarecrow said on the version I made for work:
- Update the dashboard link
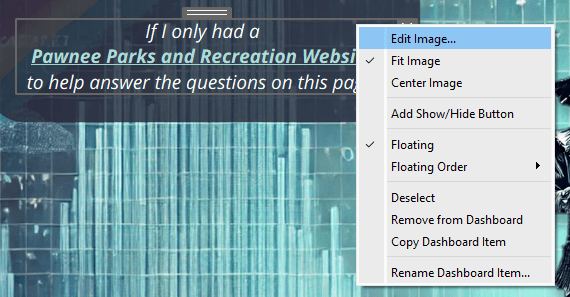
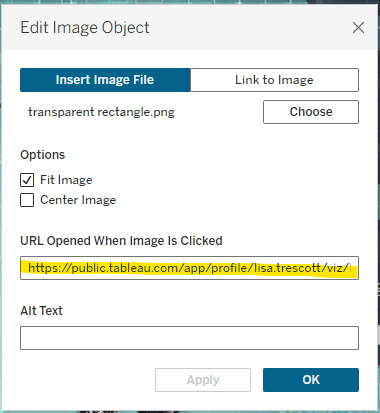
- The link is attached to a transparent shape floating over the “link” text on the dashboard.
- Right-click the transparent shape, select Edit Image, and paste the URL of your dashboard in the “URL Opened When Image Is Clicked” field.
- Update the questions
- Write three questions that encourage users to explore your dashboard.
- Replace the existing text with your new questions.
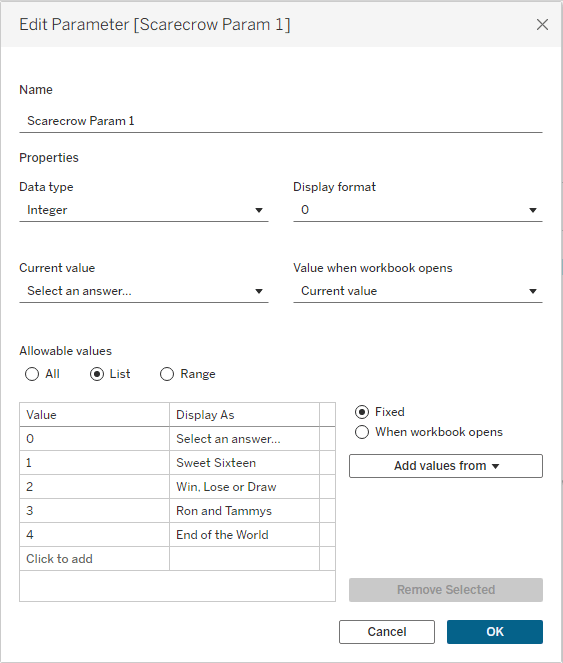
- Update parameter values
- Adjust the “Display As” values for Values 1 through 4 on each of the parameters to show answer options for your questions.
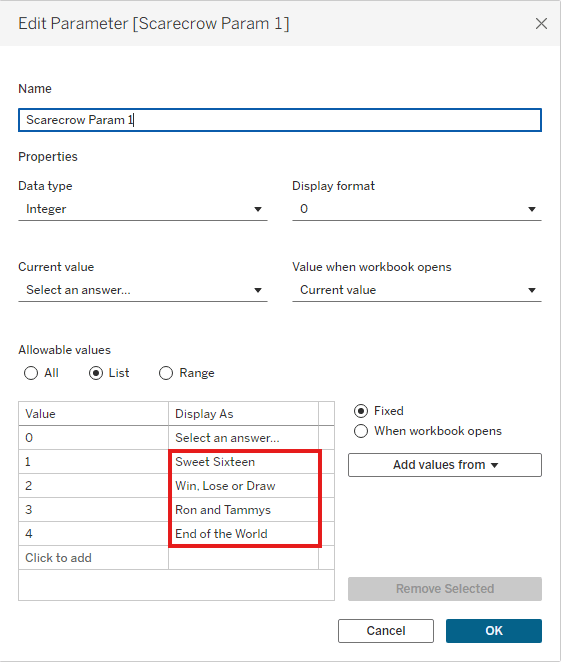
- Note: The correct answer options for each question are listed on the side of the dashboard, off the canvas. You can also find the correct answers in this Excel file.
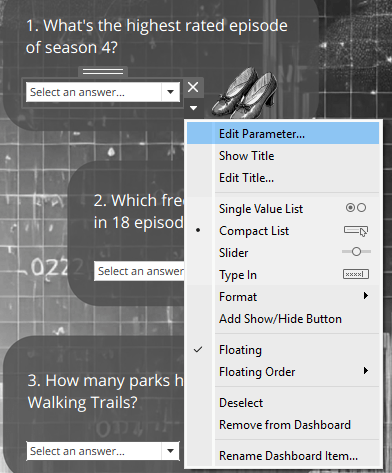
- Tip: Edit the parameter right from your dashboard by right clicking it and selecting “Edit Parameter”:
- Enchant the ruby slippers
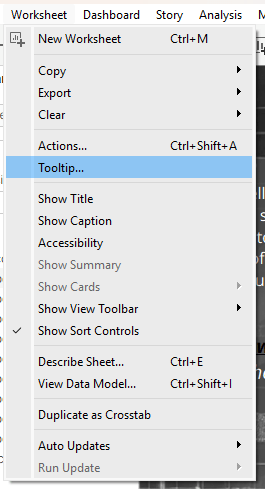
- Update the tooltips on the ruby slippers so they give hints/directions for finding the answers.
- Tip: You can also edit tooltips from the dashboard. Select the ruby slippers you want to edit, then navigate to “Worksheet” -> “Tooltip”
That’s it! Once you’ve made these updates, your ready to start sending folks down your own yellow brick road.
How it works
Curious how all the magic comes together in Oz? Let’s really go behind the curtain and dive into the mechanics of how everything works in Tableau.
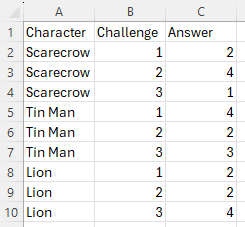
The Data
The data is an excel file that lists each character, their challenge number, and the numeric value for the correct challenge answer.
Parameters and Calculations
Each character has 3 parameters associated with them (one for each challenge), which end users interact with to select their answer. In this blog, I’ll focus on the Scarecrow, but the same setup applies to the Tin Man and the Lion.
All parameters are integers with values from 0 to 4. The value 0 serves as the default state and displays “Select an answer…”.
Each parameter is paired with a calculated field that checks whether the user selected the correct answer:
- p.Scarecrow Outcome 1
- p.Scarecrow Outcome 2
- p.Scarecrow Outcome 3
These calculations evaluate which character and challenge are being answered, and then compare the parameter value for that challenge to the Answer field in the data. For example:
{ FIXED : MAX(
IF [Character]=’Scarecrow’ AND [Challenge]=1 AND [Scarecrow Param 1]=[Answer]
THEN TRUE
ELSE FALSE
END)}
To determine whether the Scarecrow should remain in black & white or turn to color, the p.Scarecrow Outcome Final calculation checks that all three Scarecrow outcomes are true:
[p.Scarecrow Outcome 1]=TRUE
AND [p.Scarecrow Outcome 2]=TRUE
AND [p.Scarecrow Outcome 3]=TRUE
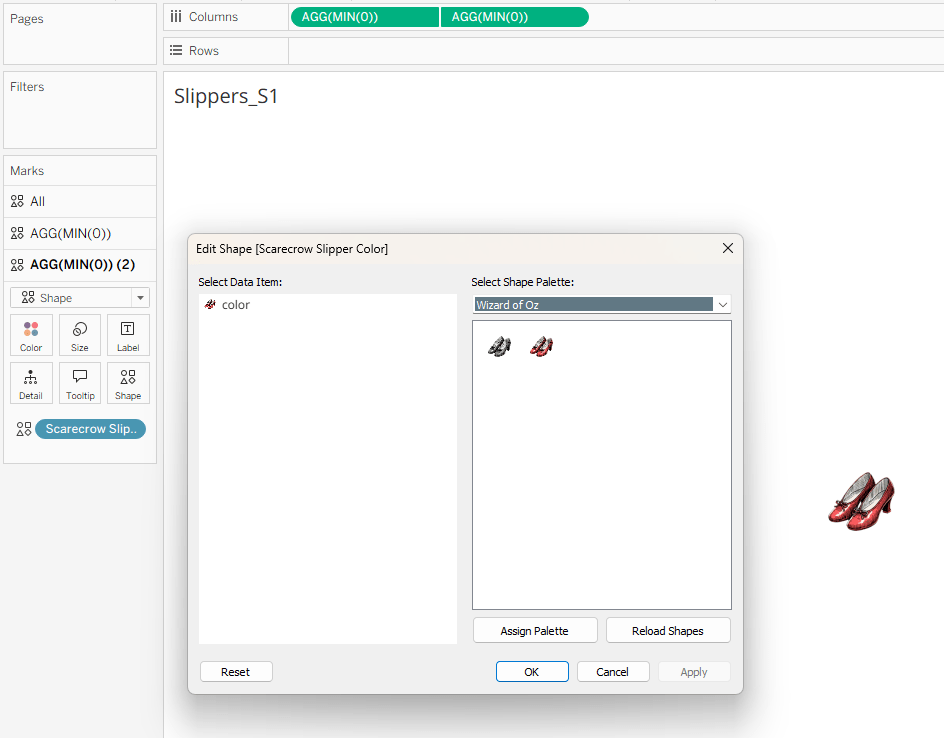
The final outcome is used in the Scarecrow Slipper Color calculation to determine whether the ruby slippers should be in black & white or in color:
IIF([p.Scarecrow Outcome Final]=TRUE,’color’,’b&w’)
p.Scarecrow Outcome Final is also referenced in tt.Scarecrow True and tt.Scarecrow False calculations. These both return the word “Scarecrow” depending on whether all Scarecrow responses are correct. These fields are formatted differently on the “Emerald City” dashboard, with tt.Scarecrow False bolded to draw attention to the fact the user needs to revisit that character.

Black and White to Technicolor
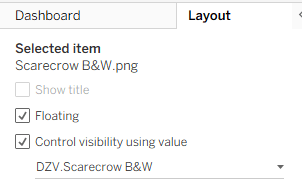
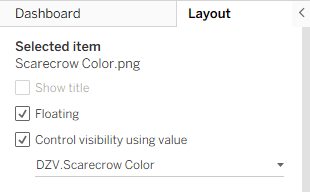
Turning the viz from black & white to Technicolor is handled using Dynamic Zone Visibility (DZV). DZV.Scarecrow B&W and DZV.Scarecrow Color evaluate whether the challenges have been answered correctly. If they have, DZV.Scarecrow Color returns TRUE; if not, DZV.Scarecrow B&W returns TRUE.
These fields are then applied in the Layout pane to control visibility, displaying either the black & white or full-color images accordingly.
DZV.Scarecrow B&W
[Scarecrow Param 1] <>2 OR
[Scarecrow Param 2] <> 4 OR
[Scarecrow Param 3] <> 1
B&W Images


DZV.Scarecrow Color
[Scarecrow Param 1]=2 AND
[Scarecrow Param 2]=4 AND
[Scarecrow Param 3]=1
Color Images


As mentioned earlier, the ruby slippers are controlled by the Scarecrow Slipper Color calculation. This field is placed on Shape for all Scarecrow slipper sheets, assigning a black & white slipper when the value is FALSE and a ruby slipper when it is TRUE.
The image on the Emerald City dashboard transitions to color based on the outcome of DZV.Final Color, which evaluates whether all three characters have been completed successfully:
[DZV.Tin Man Color]=TRUE
AND [DZV.Lion Color]=TRUE
AND [DZV.Scarecrow Color]=TRUE
When this condition is met, DZV reveals the full-color Emerald City and the congratulatory text.
The text that appears on the Notice board when all challenges have not been answered correctly is populated through the title of the “Notice Text” worksheet. Using the title allows the text to be conditionally formatted, highlighting specific characters whose challenges still need to be revisited.
Finally, the character images change behavior based on whether their challenges have been answered correctly. When all responses are correct, the character appears as a static, full-color image controlled by DZV.Scarecrow Color. When responses are incorrect, the character displays in black & white and functions as a navigation button, controlled by DZV.Scarecrow B&W.
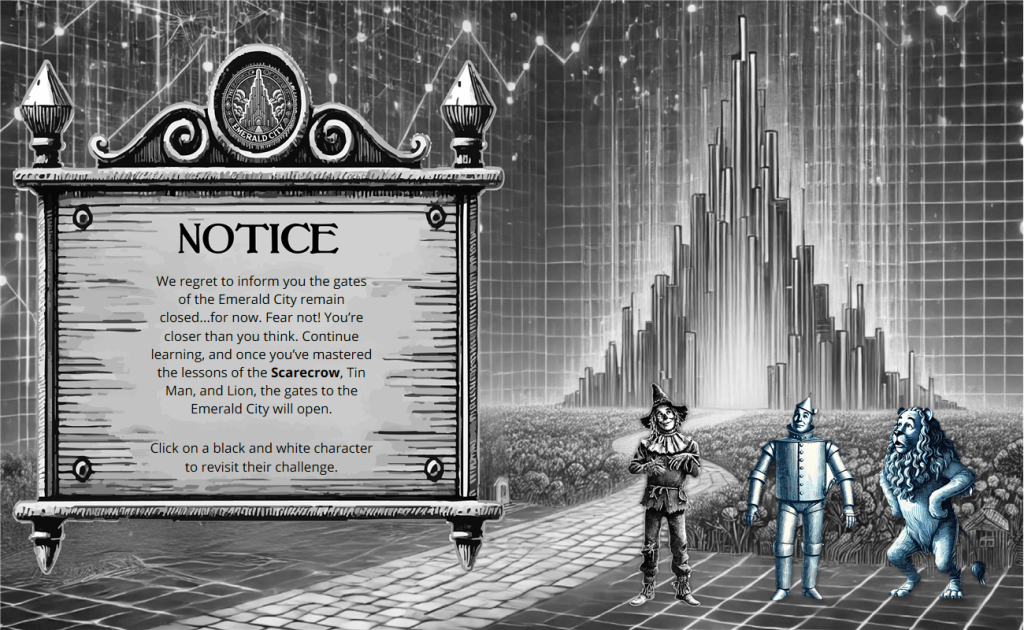
Once all challenges have been answered correctly, all characters are in color, the gates to the Emerald City open, and congratulations text appears.

Wrap Up
Thanks for coming along on this journey down the Yellow Brick Road! I hope this peek behind the curtain gives you a fun new game to engage your users, and perhaps inspired you to try a few new things in your own Tableau dashboards. Now click your ruby slippers together and build something Oz-some!

Leave a comment