

One of the biggest game-changers in my Tableau journey was learning from the Flerlage Twins that, at its core, Tableau just uses X and Y coordinates to plot data. Once you realize that, the possibilities for charting in Tableau are endless! You can create anything from custom maps to intricate charts to state-filled boxes of chocolate:

For my Makeover Monday viz displaying state’s favorite Valentine’s Day Candy, I thought it would be fun to arrange the US states into a heart-shaped box of chocolates. Manually plotting these points would have required a big time investment. Luckily for me, I remembered a tool that Kimly Scott mentioned in her presentation at a Tableau Public TUG meeting. She demonstrated how she used InterWorks’ CBI Studio to generate custom coordinates for her Matilda Effect viz, and as someone who had spent way too much time manually placing X and Y coordinates in the past, I immediately bookmarked it!
In this post, I’ll walk through how to use CBI Studio to generate custom coordinates for your own vizzes, but please note that InterWorks also has a tutorial video and blog for this tool. Be sure to check them out since I’ll only be covering the features I used, and pointing out some helpful tips to go from an image, to coordinates, to shapes, to a final viz:

Let’s Plot!
When you open the tool, you can select an image or a map. “Image” allows you to plot points using an image. “Map” lets you plot coordinates or geographic areas on a map. I’ll be talking about the “Image” option.
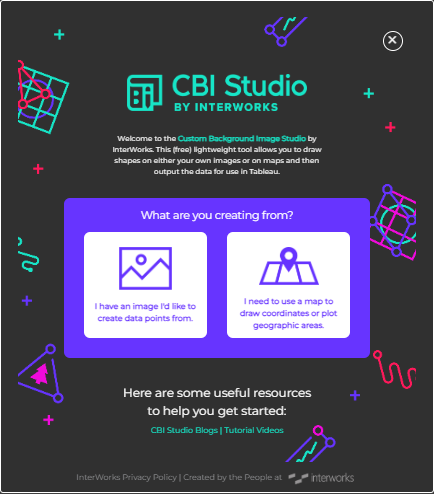
When you select “Image”, you’ll see a screen where you can drag and drop the image you want to use. In the top right corner, there are other options for bringing in images, including using a blank canvas if you want to plot points more freely.

In my case, I was plotting points on a heart, so I dragged an image of a heart onto the canvas.

From there, just start clicking to add points. In my viz, each point represents a state, so I positioned them in the general area where each state is located on a map.
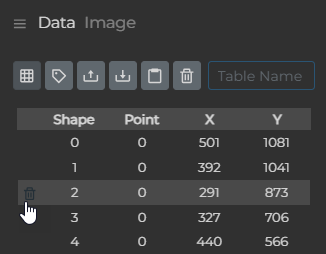
As you add points, you’ll see their coordinates being added in the right-hand panel. Tip: name your coordinates as you go (especially if you’re planning to join them to other data…like state names). Just click the “Edit Shape Labels” icon to add your labels.

If you want to move a point after it’s placed, just click and hold it until your cursor turns into a little fist. Move your point, then release. Notice the X and Y values in the top left corner changing as you move the point.

If you want to delete a point, find that point in the data pane, hover over it, and you’ll see a subtle trash can to the left of the point. Click that trash can to delete that point. Note: The trash can at the top of the data pane is to delete ALL your points. Don’t click that one unless you want to clear everything out.
Once you have all your points plotted, click the “Download” button to get a CSV file of all your points. From there, you can bring it into Tableau and start using it. I joined my data to the Makeover Monday dataset on State Name = Shape Label.

Once in Tableau, add “Point X” to Columns, “Point Y” to Rows, and “Shape ID” to Detail. Voila! Your points are plotted.
Each one of my points represented a state, so I also added “Shape Label” to Shape, and assigned each state to its corresponding shape. I found a free SVG download of all 50 states on the Dream A Little Bigger blog. I modified the shapes to all be roughly the same size, created my own shape for Washington D.C., then added them all to my Tableau Shape Repository. You can download all the shapes I used here.
When I originally applied the shapes, some states overlapped, so I needed to tweak a few points. No worries! If you’ve already closed CBI Studio (and lost your previous data), just hit the “Import Data” button in the bottom right corner to bring all your points back into the tool.
From there, you can modify your points, download the new data, and refresh it in Tableau.
Keep in mind this tool is specifically designed to let you use your image directly in Tableau as a background map. I didn’t take that approach since I only used the heart as a guide to create my coordinates, but that option is available (and it’s actually the tool’s intended purpose).
Wrap Up
And just like that, you’re now a custom coordinates wizard! And remember, CBI Studio isn’t just about points. You can also explore features for paths, polygons, and custom mapping. So go forth, experiment, and make some beautifully mapped (or wildly unconventional) visualizations. I can’t wait to see what you come up with!

Leave a comment