

At Tableau Conference 2025 (TC25), I had the opportunity to present my 6-Step Road Map to Impactful Vizzes (based on this blog post). During my session, I walked through my process of going from a blank Tableau workbook to a completed viz (you can watch the session on Salesforce+) and check out my slides below:
Throughout the presentation, I mentioned several resources that I often rely on when designing vizzes and dashboards. Below, you’ll find a complete list of all the resources I mentioned in my presentation.
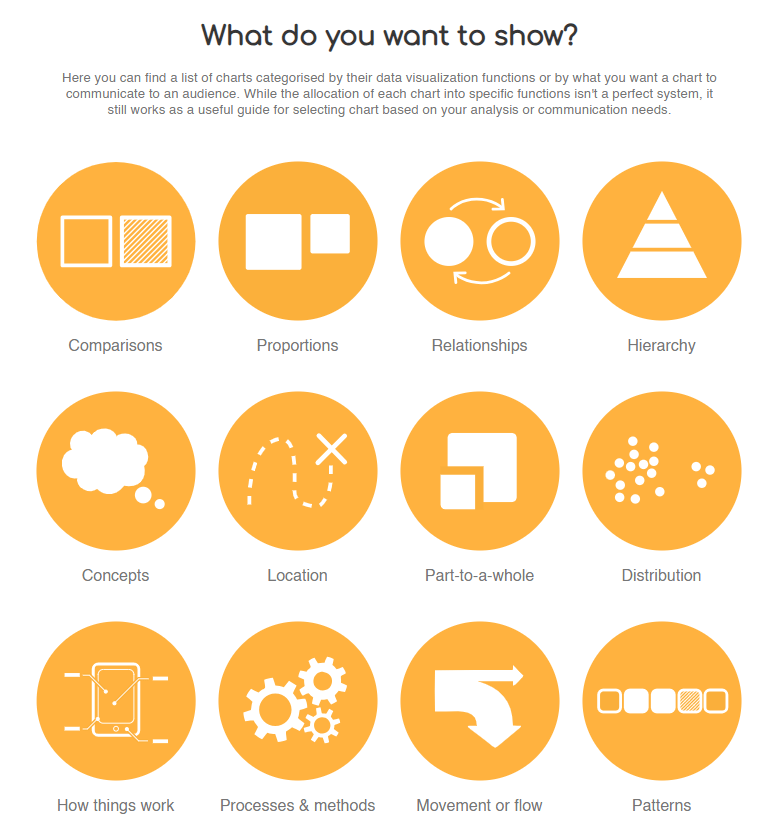
Chart Selection
- Visual Vocabulary: Andy Kriebel showcases different charts by category in a Tableau workbook.
- Data Visualization Catalogue: Search for charts by name or by function
Wireframe
I typically sketch my wireframes, but here are some tools you may want to use instead:
- Excalidraw: Create wireframes with a hand-drawn effect
- Figma: Create from scratch or use one of their templates/kits
- Miro: Collaborative whiteboard platform designed for brainstorming, planning, and visual collaboration
Keep eye-tracking patterns in mind when planning your layout.
- Tableau’s eye-tracking study
Design
Color
Color Palettes
- Psychology of Color: How color in design can affect emotions and moods.
- Color Palette Generator: Easily generator color palettes for your next dashboard
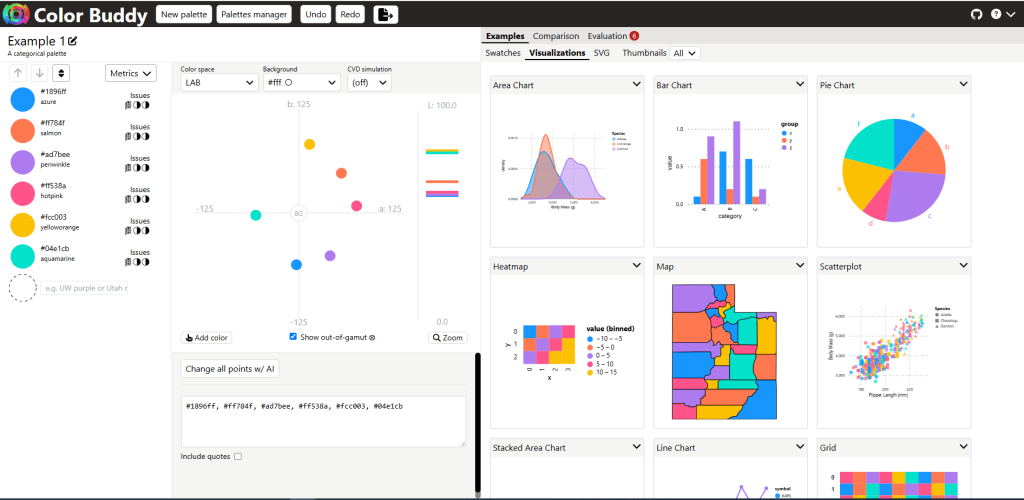
- Color Buddy: See how your color palette will look on different chart types and ensure they meet accessibilty standards. Here’s an example with the TC25 color palette:
Color blind
- Coblis: Simulates color blindness of an image
- Upload an image of your viz/dashboard to simulate different types of color blindness
- Colorblindly: Simulates color blindness in your web browser
- Publish your viz/dashboard, then turn on the colorblindly extension to simulate different types of color blindness
- Swap Palettes Tutorial: Sometimes you’re stuck using colors that aren’t colorblind friendly. One way to get around that is to let users choose which color palette they want to use (colorblind friendly or non-colorblind friendly). In this video, Andy Kriebel demonstrates how to swap color palettes using a parameter in Tableau
Text
- Color Contrast Checker: Helps you ensure text and colors meet accessibility standards.
- Font Psychology: This video is a great overview of how typography evokes emotions.
- Psychology of Typeface Selections: Article discussing how fonts set a tone.
Icons
Here are some of my favorite sites for icons (note that some have both free and premium options):
- Hero Icons: Free basic icons
- Fontawesome: Includes free and pro versions
- Noun Project: Available in both free (with attribution) and paid versions
- Material Icons: Google’s free icon library
Images
Here are some of my favorite sites for free stock images:
- Unsplash: One of the best sources for high-resolution, artistic photography. Free to use without attribution.
- Pixabay: Over 2 million free stock photos. Free to use without attribution.
- Pexels: Large collection of perofessional-quality photos. Free to use without attribution.
Want to recolor an image to better match your color scheme? No problem! You can recolor images for free using LightX.


Image by Saso Tusar
Function
Check out my blog post and companion Tableau Public workbook to learn how to start creating custom UI elements to Design Beyond Defaults.


Leave a comment